- Home
- Free tools
- Quick Pareto chart
Free tool · Lean
Draw your Pareto chart
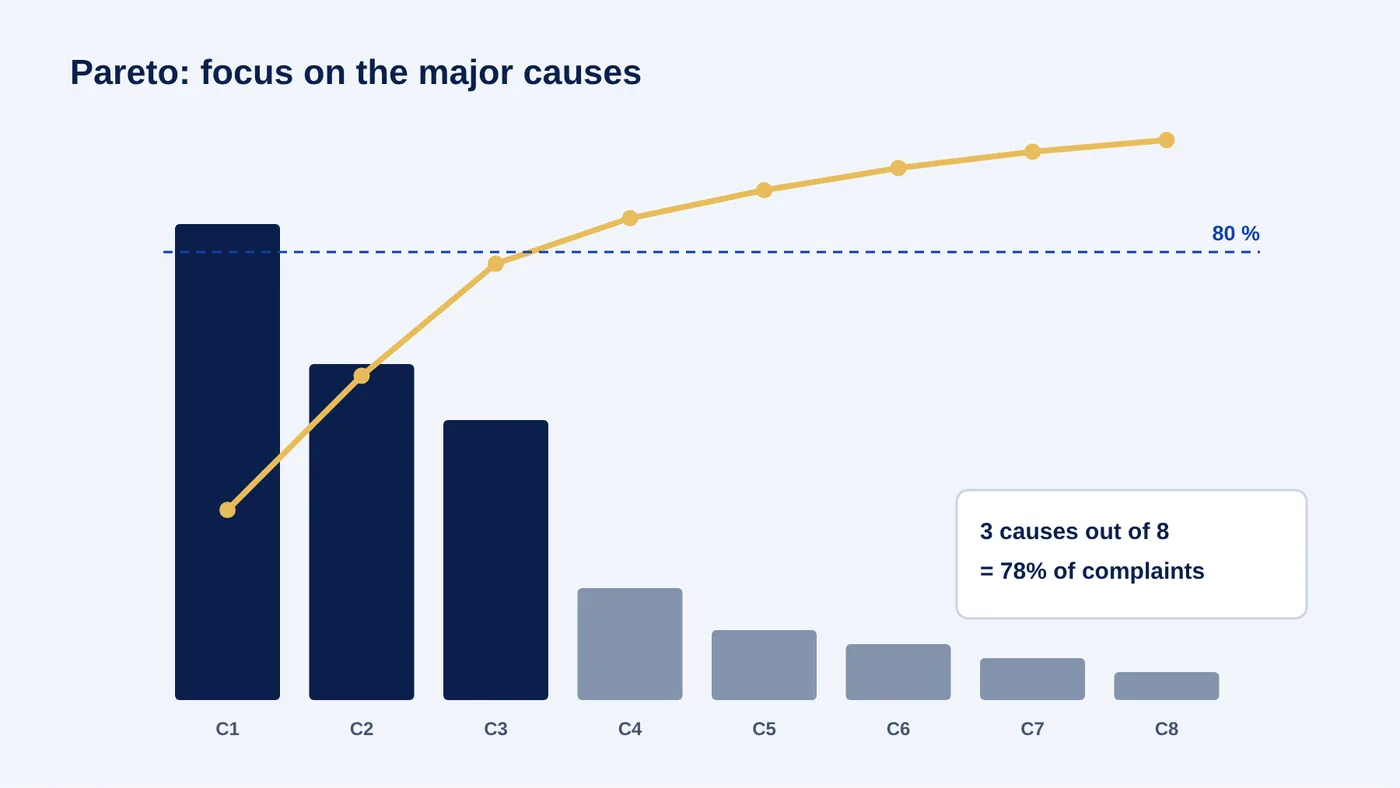
One line per cause with its number of occurrences. The chart ranks the causes and shows those explaining most of the problem.
The Pareto principle: a minority of causes often explains most of the effects. Focus your actions on the first bars.
Get the full Excel version
Pareto chart in Excel
- The full template, for your whole project, not just one calculation
- Formulas, charts and alerts already built: you fill it in, it calculates
- A worked example and a guide, in French or English
- One-off payment, company licence, instant download
€29 excl. VAT one-off payment
See my selection and pay (0)See the tool in detailAll free tools
Need several tools? The Lean and Continuous Improvement Pack brings all 15 tools together for €149 excl. VAT, i.e. €10 per tool instead of €29.