- Home
- Tools and courses
- Pareto
Included in the Lean and Continuous Improvement Pack
Pareto
The chart that ranks causes by importance, to focus effort on the few causes that weigh the most.
€29 excl. VAT€34.80 incl. VAT, this tool only
Method guide, blank template and PDF + PowerPoint course included
Total:
See my selection (0)Company licence included
Unlimited use and editing within your company, including to train your teams. Your tools in your brand colours: on quotation
Card, PayPal, Apple Pay or Google Pay. No account. Invoice sent by email.
When to use it
When there are many problems and you must choose where to start.
Where does it come from?
It is named after the economist Vilfredo Pareto, who observed an 80/20 distribution at the end of the 19th century. Joseph Juran later applied it to quality.
Case study, fictional example
Customer complaints at a packaging manufacturer
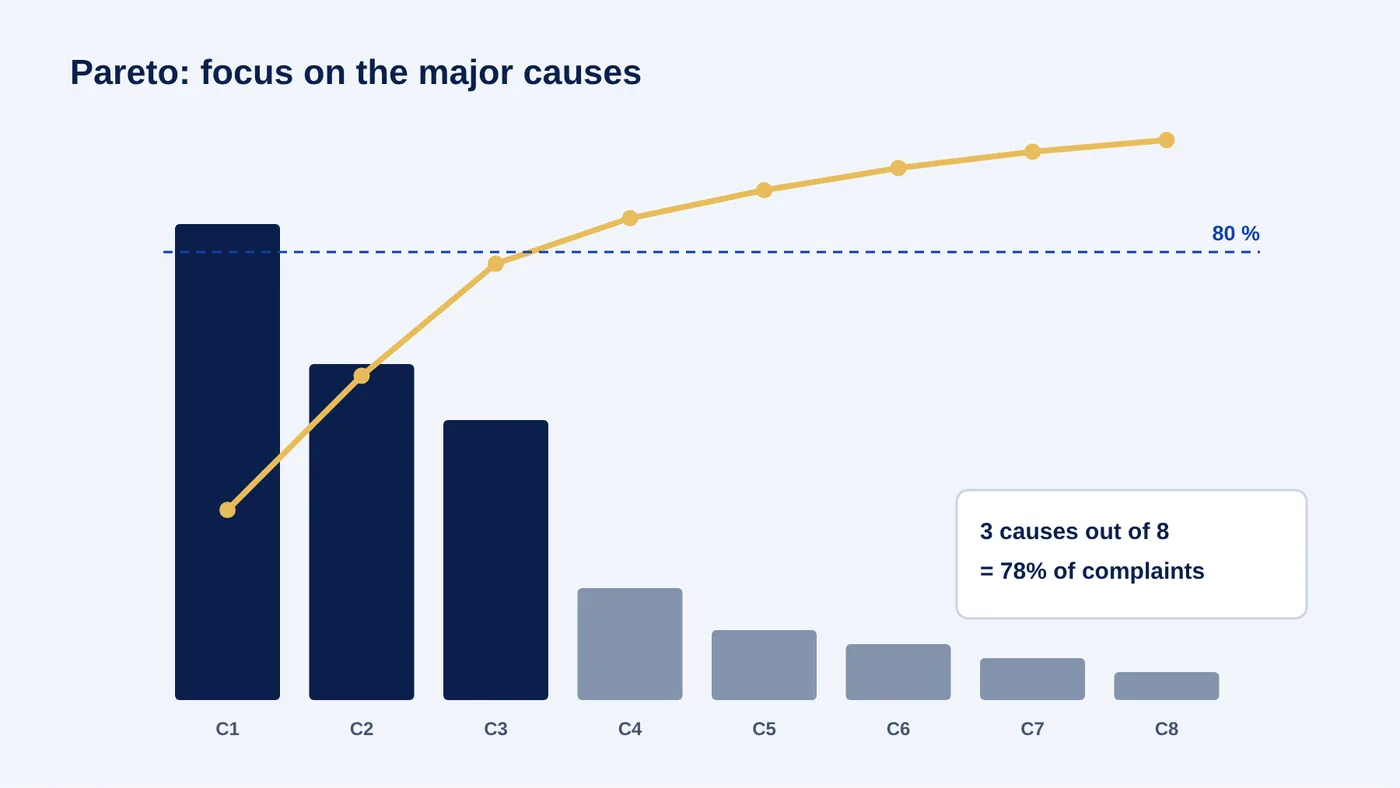
Out of 8 complaint causes, 3 account for 78% of complaints. The team tackles these 3 causes first, and complaints are halved within a quarter.
The steps
- Record the problems and their frequency
- Rank them from most to least frequent
- Plot the cumulative total
- Deal with the major causes first
What the template contains
- Data entry table
- Automatic ranking
- Chart with cumulative curve
- 80% marker
Related terms
- Pareto chart
- 80/20 rule
- Prioritisation
- Quality
The case study is a fictional example, written to show how the tool is used.
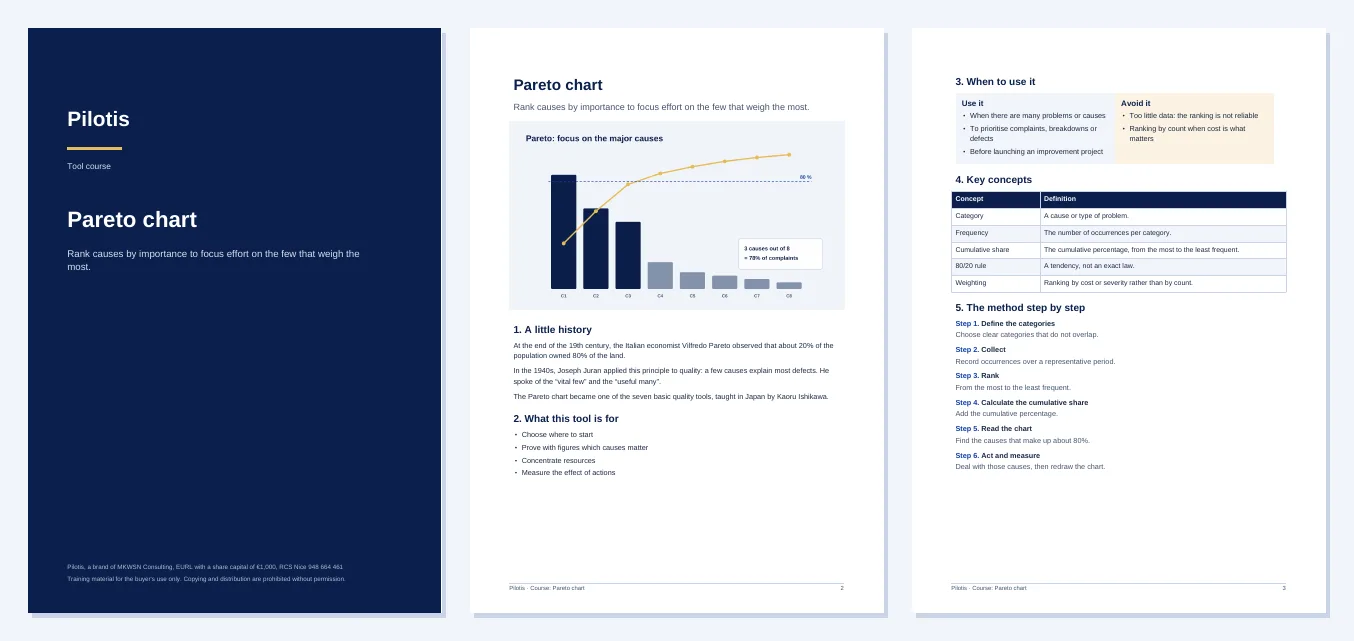
Course preview
Extracts from the PDF handbook you receive. The PowerPoint deck covers the same content, ready to present to your teams.
Optional extra · €5 excl. VAT
The practice quiz: 30 questions
Check you have mastered the method before applying it: concepts, method and worked case studies, each question corrected and explained.
- Corrected practice and timed mock exam
- Score by theme
- Questions and answers shuffled on every attempt
- File to keep, works offline
Test yourself · 3 questions
Can you answer these?
Instant answer and explanation. Free, no sign-up.
What does a Pareto chart show?
- AThe project schedule
- BA geographic breakdown
- CCategories ranked from most to least frequent, with the cumulative total
- DA trend over time
Frequently asked questions
- When will I receive the template?
- Right after payment: you land on a page where you can download your files.
- Can I edit the template?
- Yes. It is an open Excel file that you can adapt to your company and project.
- What does the course include?
- It comes free with the tool: a PDF handbook and a PowerPoint deck ready to present, to understand the tool and train your teams. The Excel file also has a Guide tab (step-by-step method, mistakes to avoid, checklist) and a blank copy ready to fill in.
- What software do I need?
- Microsoft Excel 2019 or later, or Microsoft 365.
The other tools in the Lean and Continuous Improvement Pack
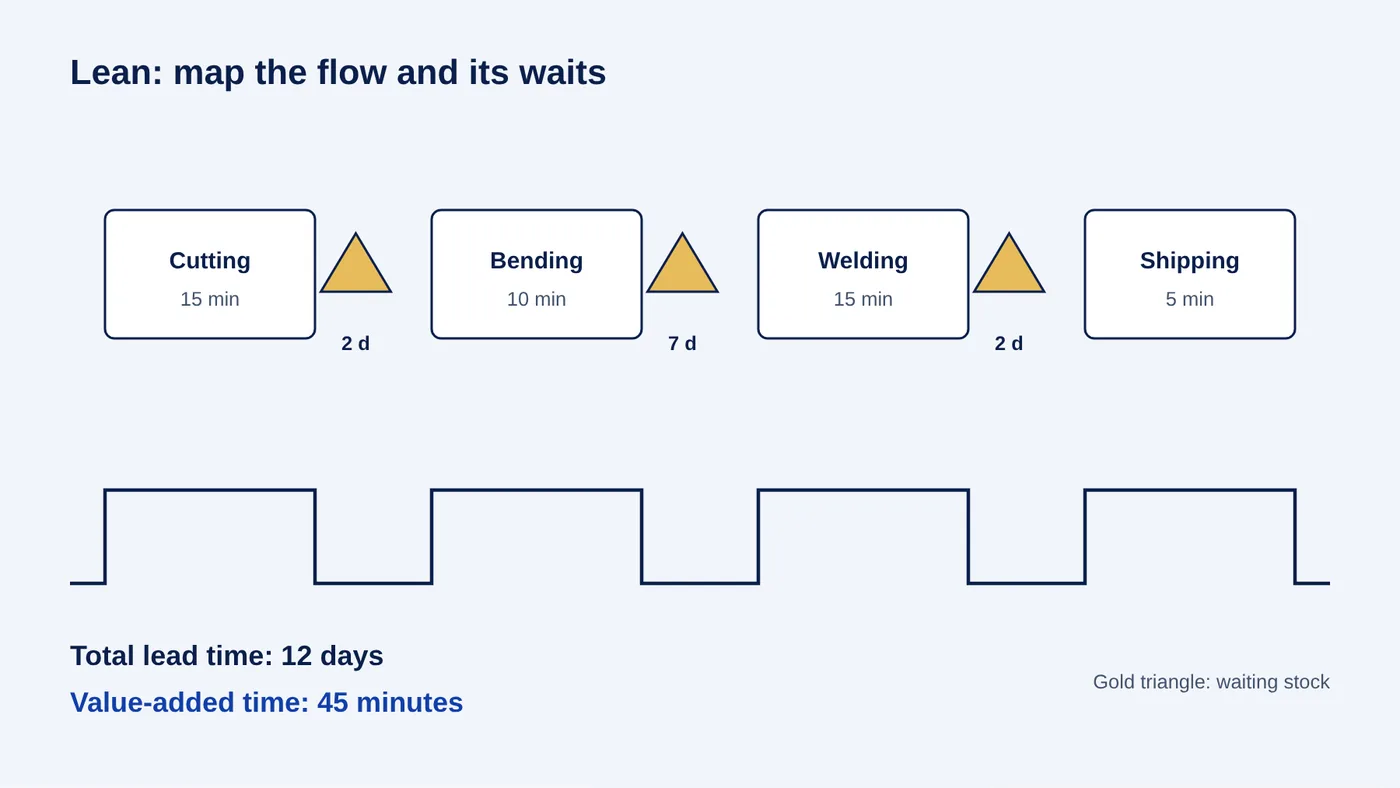
Lean
Mapping a process, step by step, to spot waiting, stock and waste.
€29 excl. VAT · course included
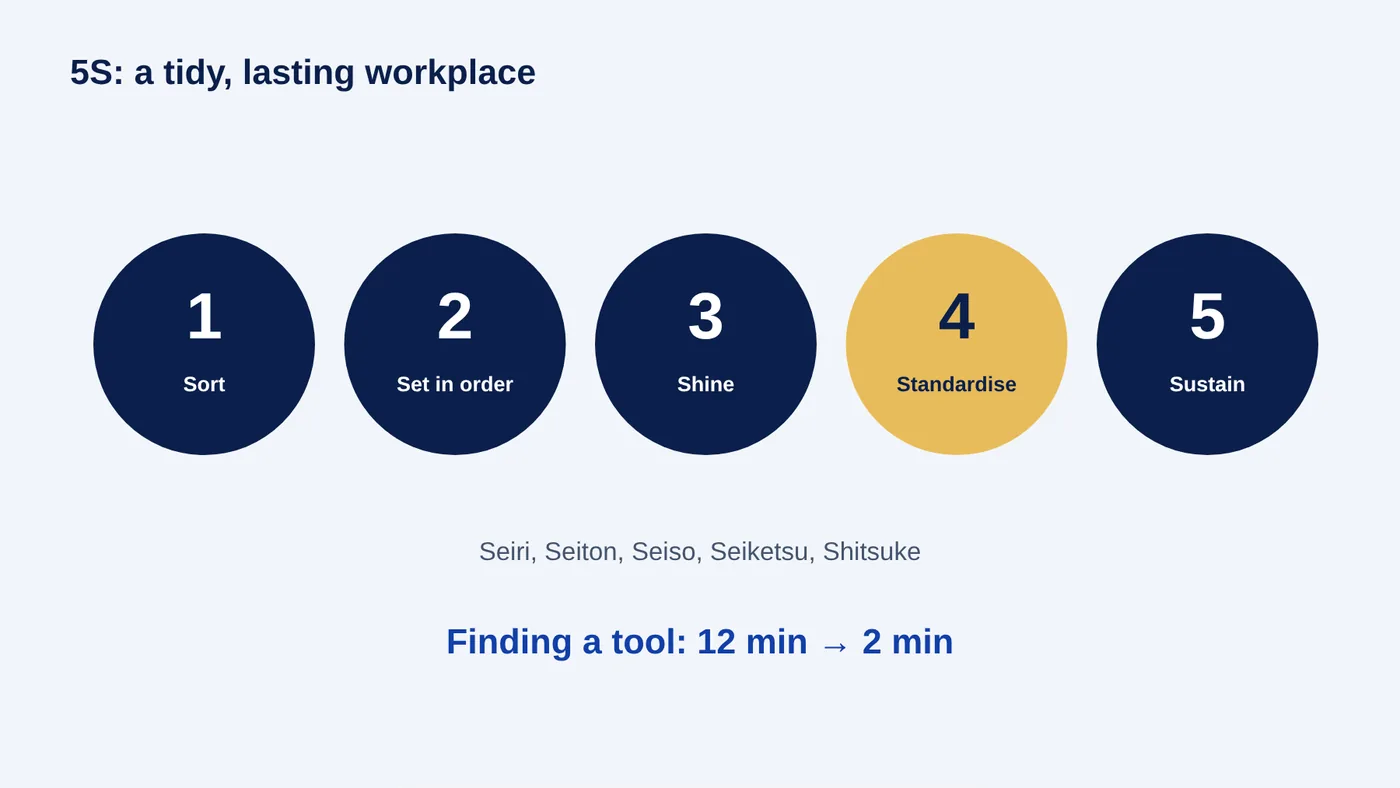
5S
Five steps for a tidy, clean and lasting workplace: sort, set in order, shine, standardise, sustain.
€29 excl. VAT · course included
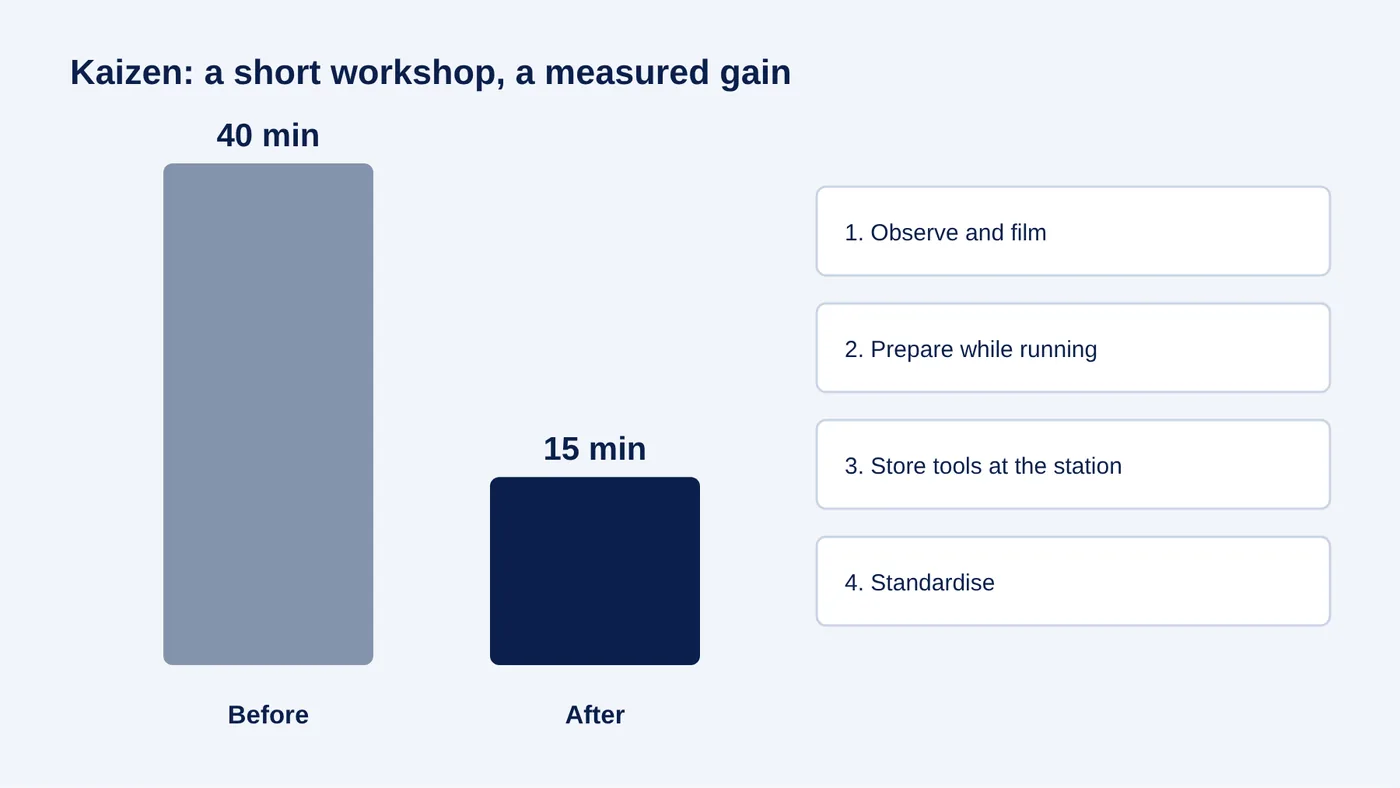
Kaizen
The short improvement workshop, run with the shop-floor team, to gain quickly on a specific point.
€29 excl. VAT · course included
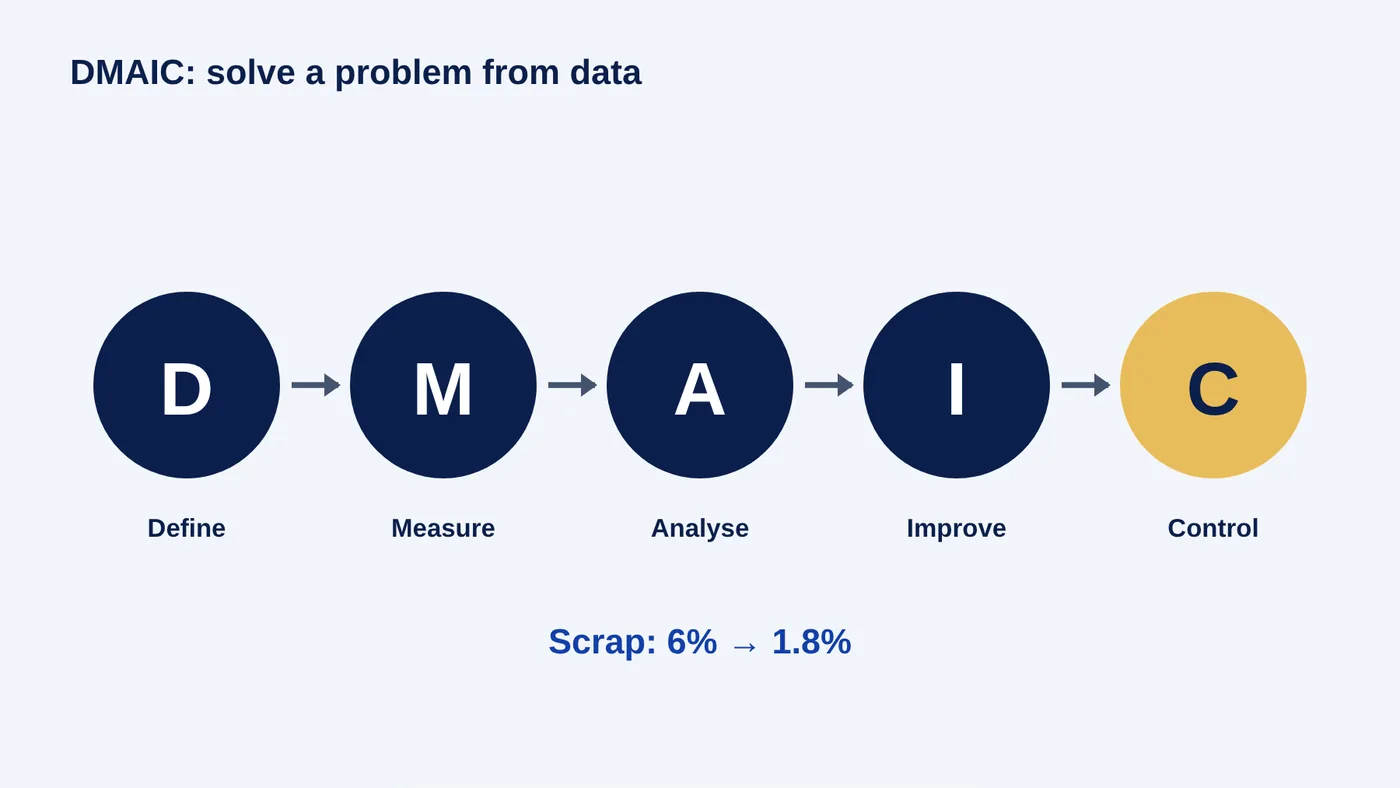
DMAIC
Six Sigma's five-step approach to solving a complex problem from data.
€29 excl. VAT · course included
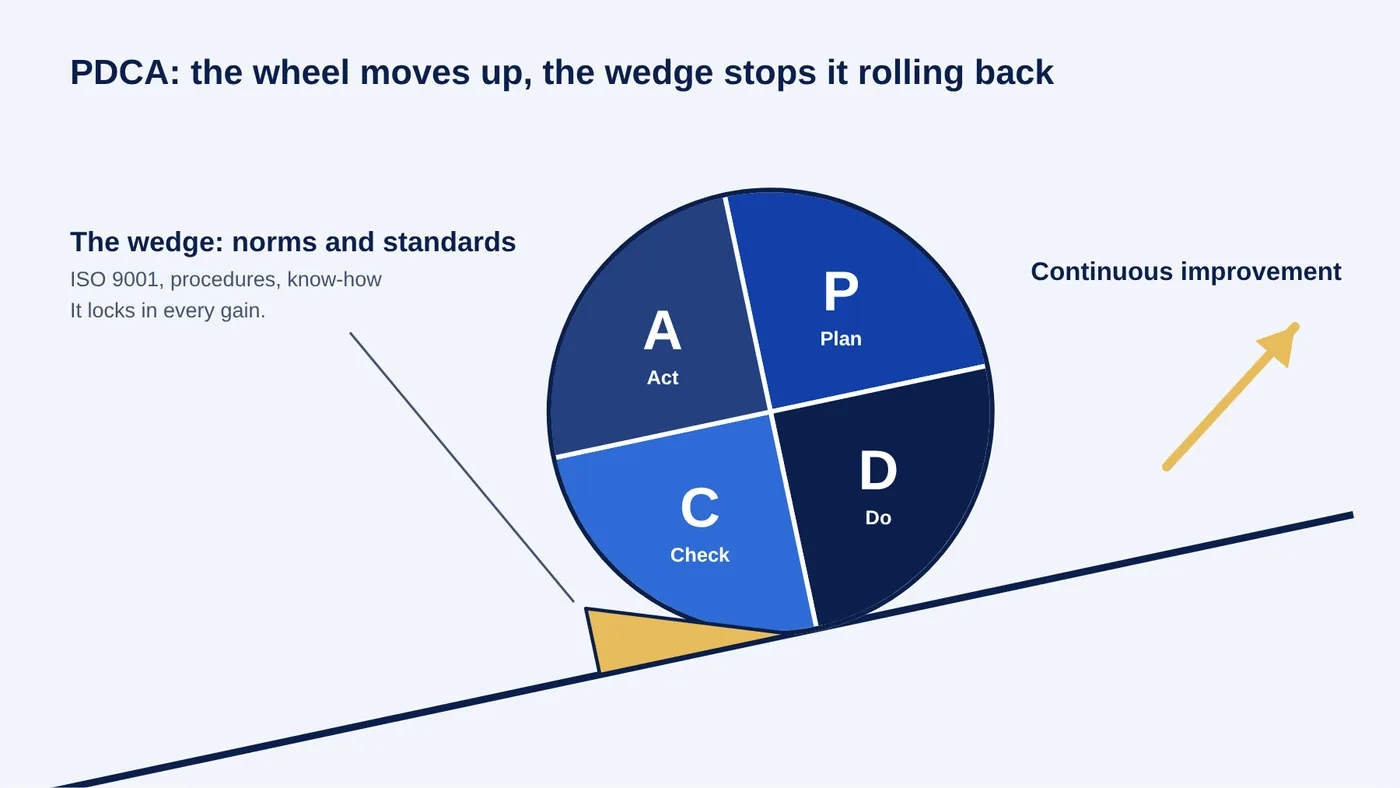
PDCA
The improvement wheel: plan, do, check, then act, and start again.
€15 excl. VAT · course included
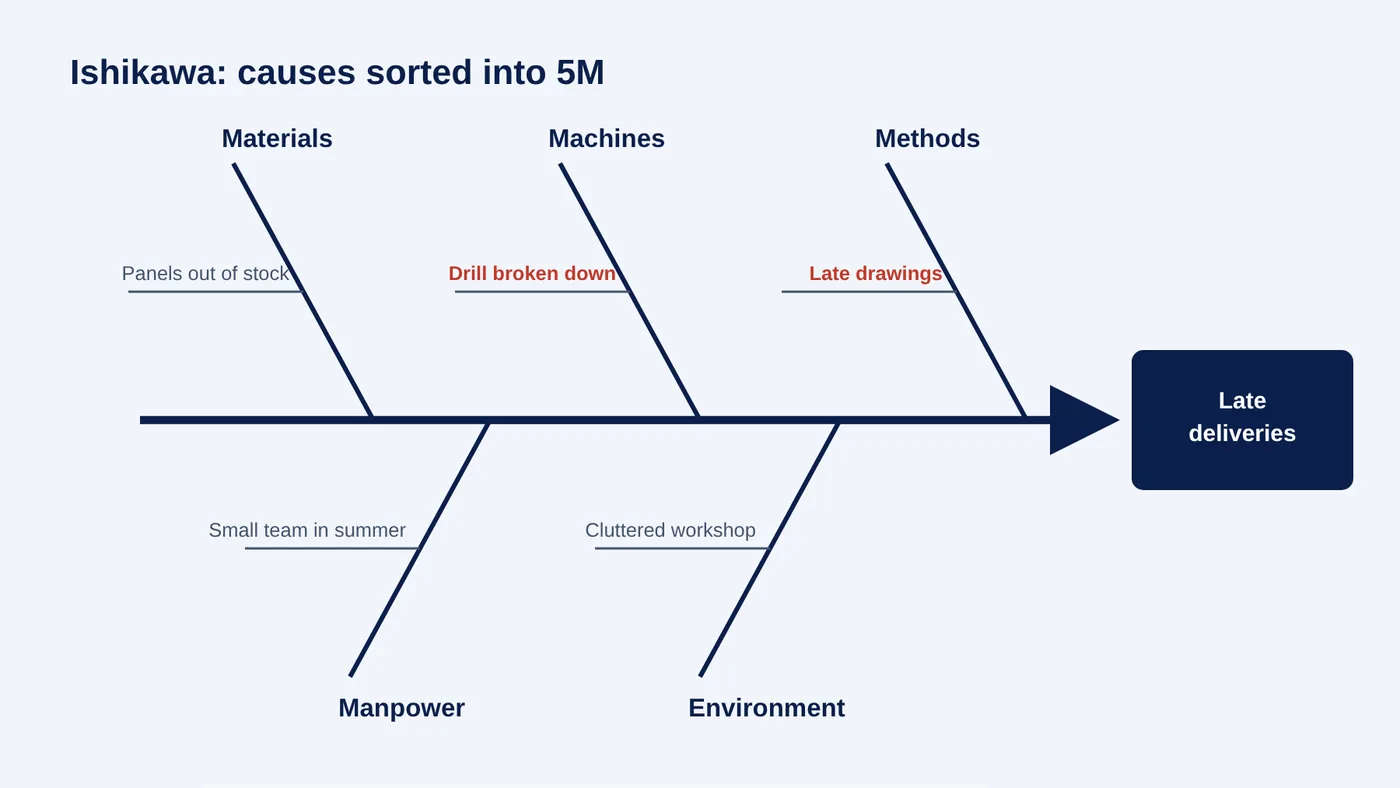
Ishikawa
The fishbone diagram that sorts all possible causes of a problem by family.
€29 excl. VAT · course included
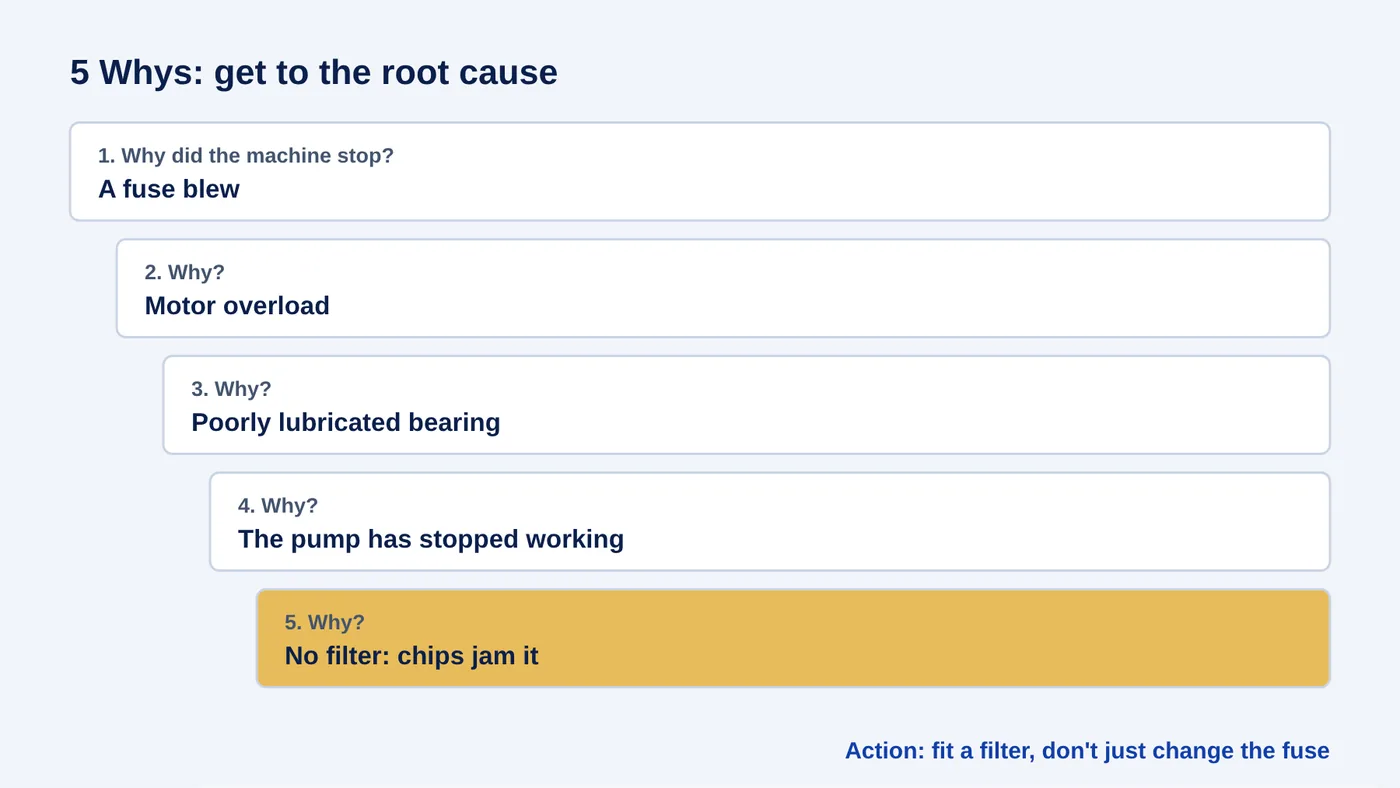
5 Whys
Five successive “why” questions to go from the symptom to the root cause.
€15 excl. VAT · course included
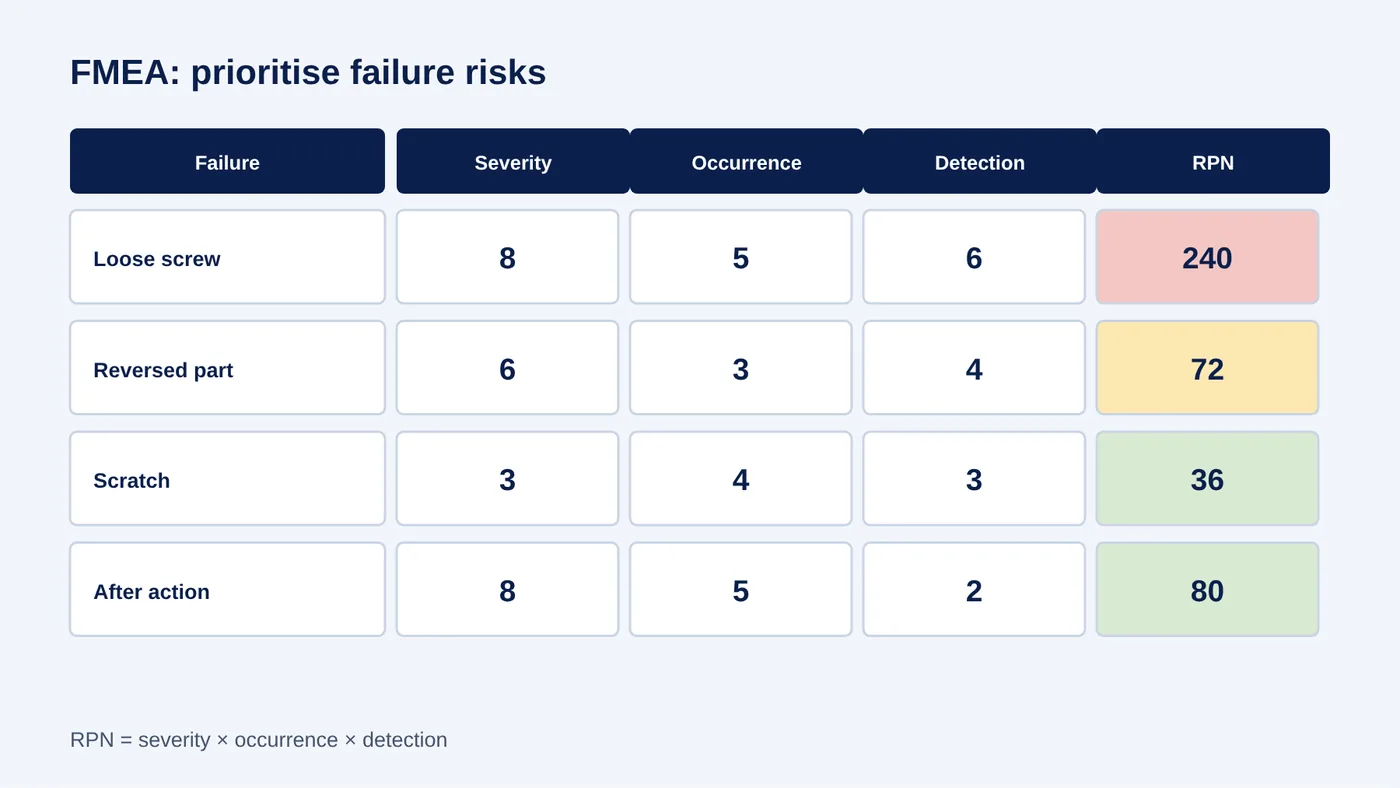
FMEA
Failure mode, effects and criticality analysis, to prevent problems before they happen.
€29 excl. VAT · course included
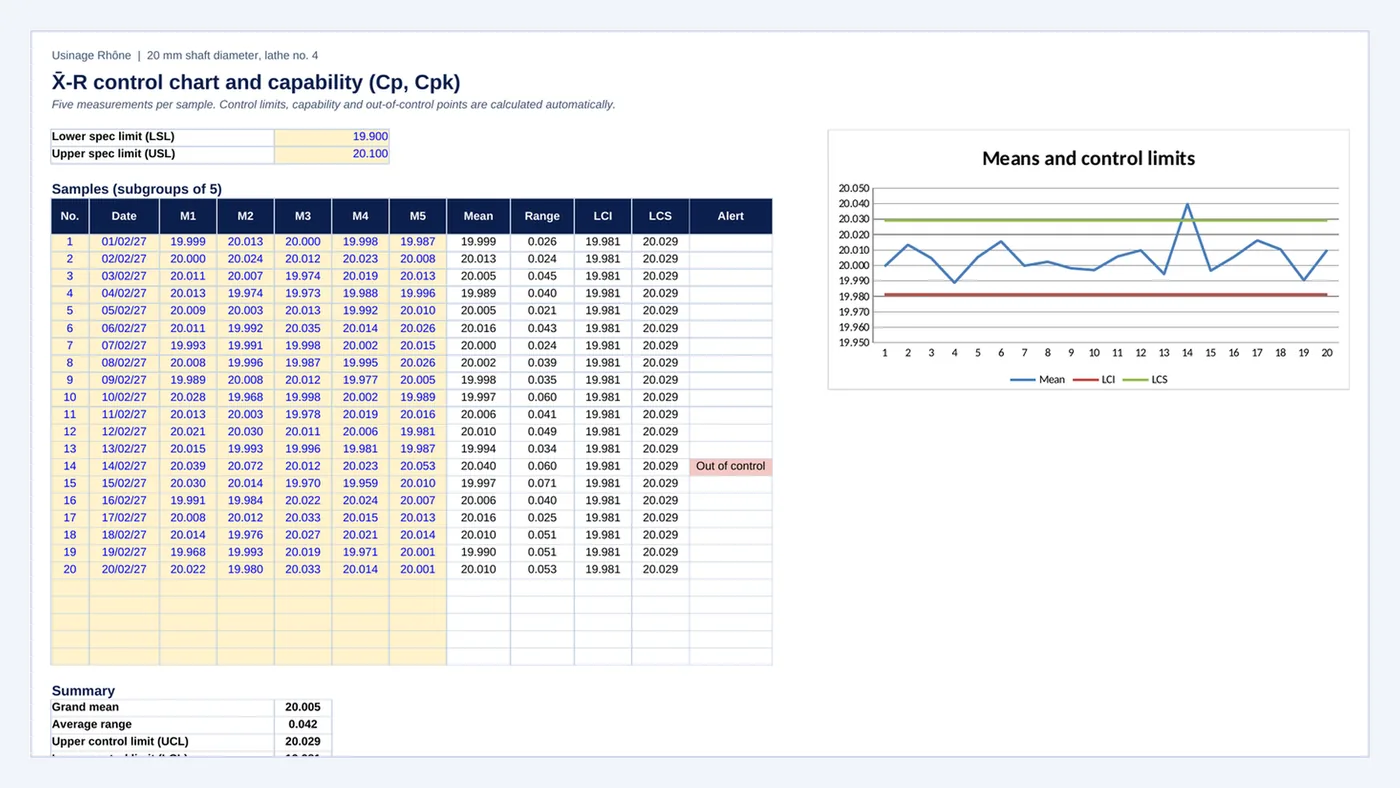
Control chart and Cpk
Five measurements per sample: control limits, out-of-control points and Cp and Cpk capability calculated automatically, with the means chart.
€29 excl. VAT · course included
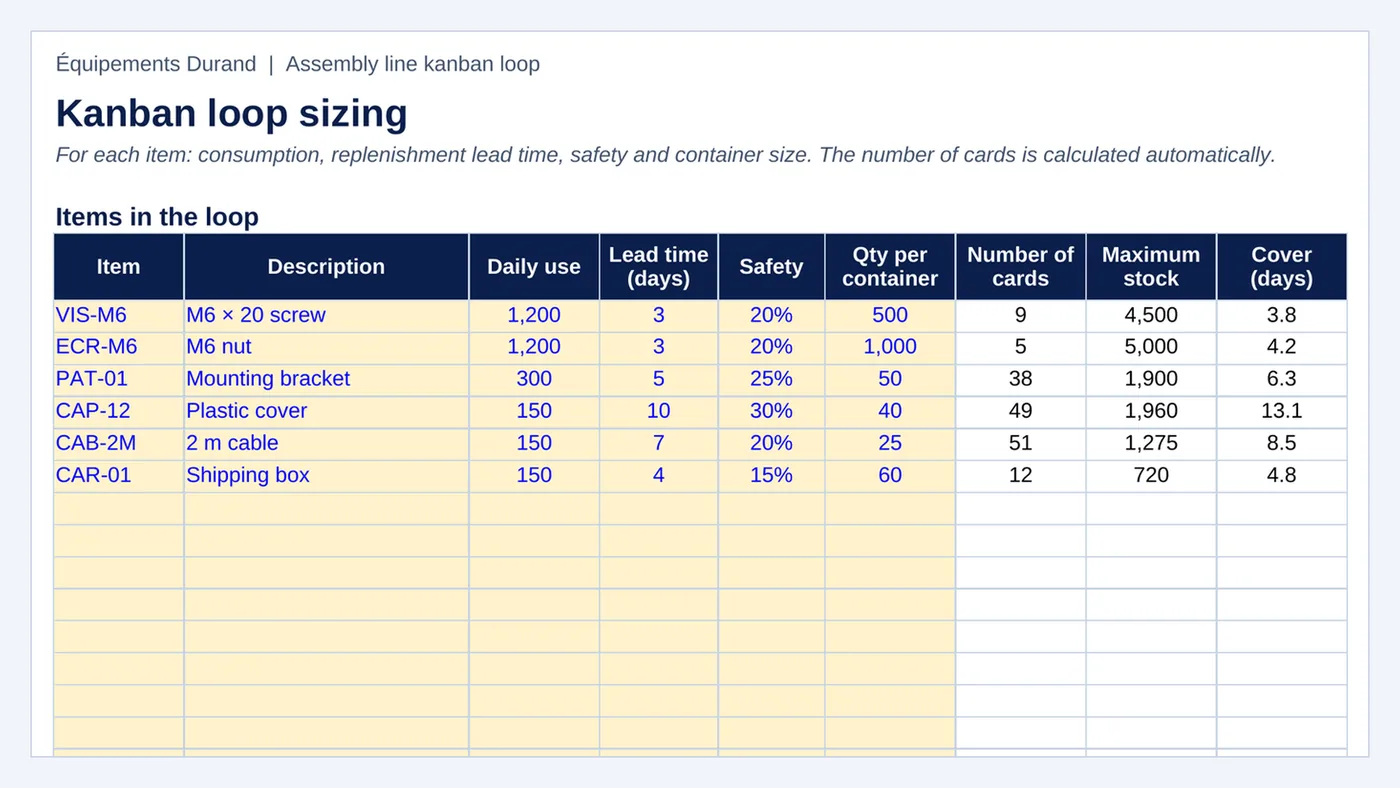
Kanban loop
For each item: consumption, lead time and container size. Number of cards, maximum stock and cover are calculated automatically.
€29 excl. VAT · course included
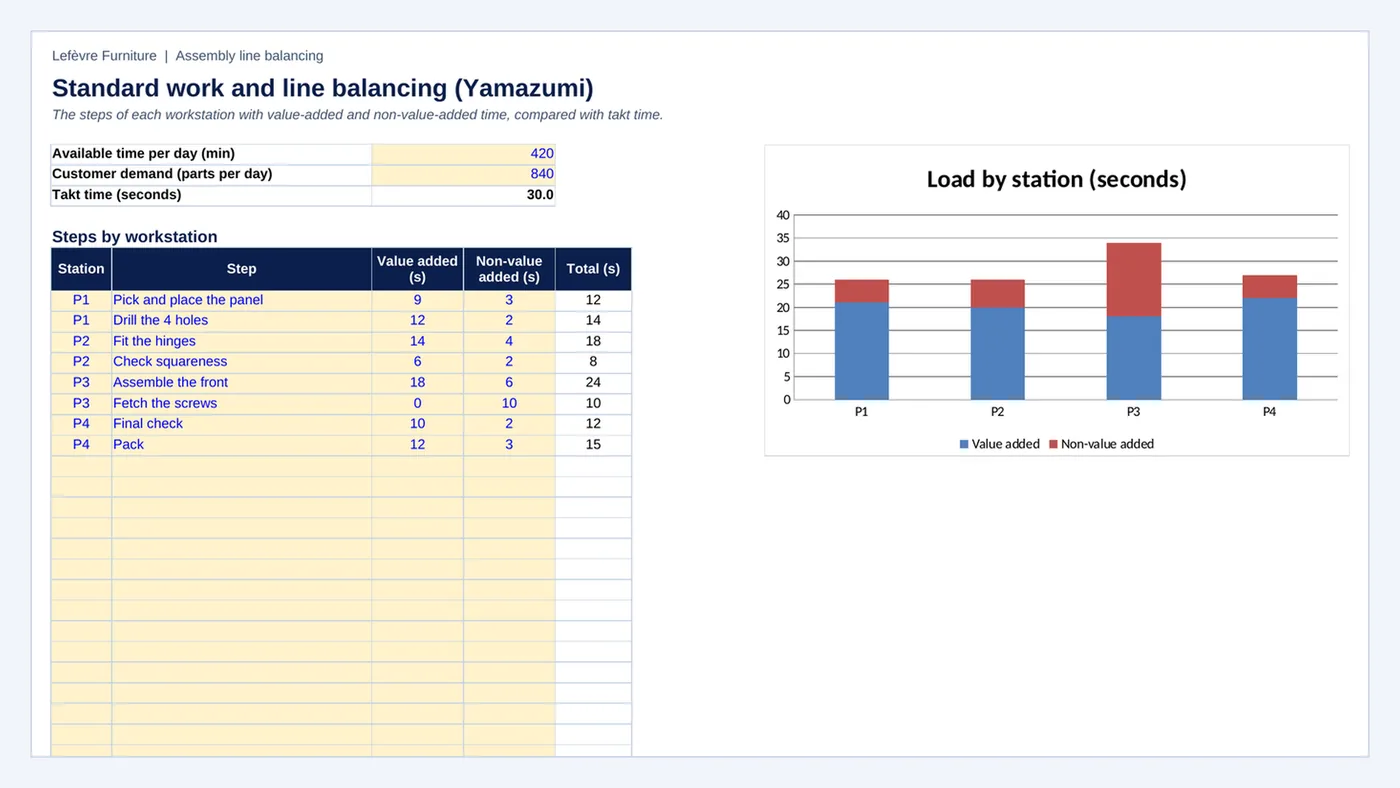
Standard work
The steps of each station with their value-added time, compared with takt time, and the Yamazumi chart to balance the line.
€29 excl. VAT · course included
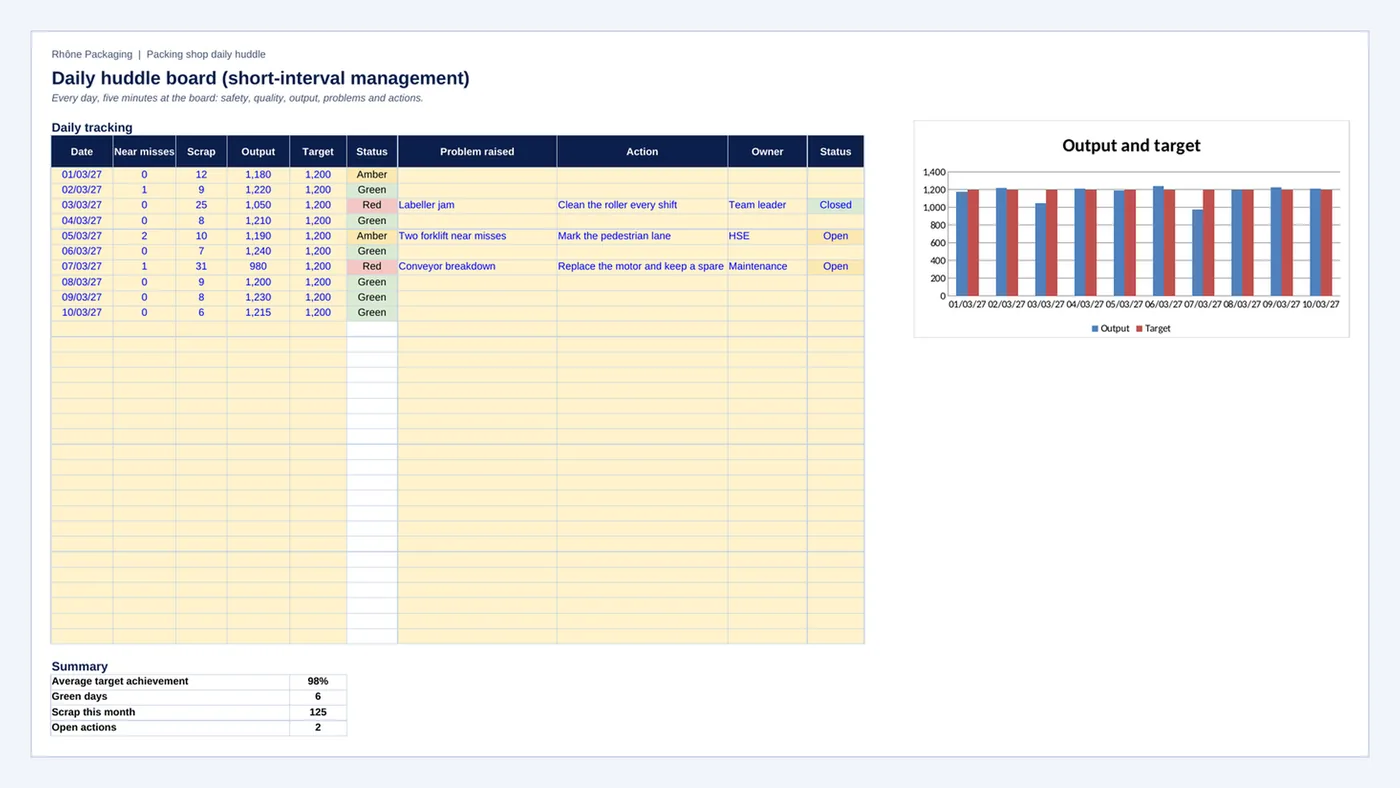
Daily huddle board
The five-minute daily huddle: safety, quality, output, today’s status, problems and actions, on a single board.
€29 excl. VAT · course included
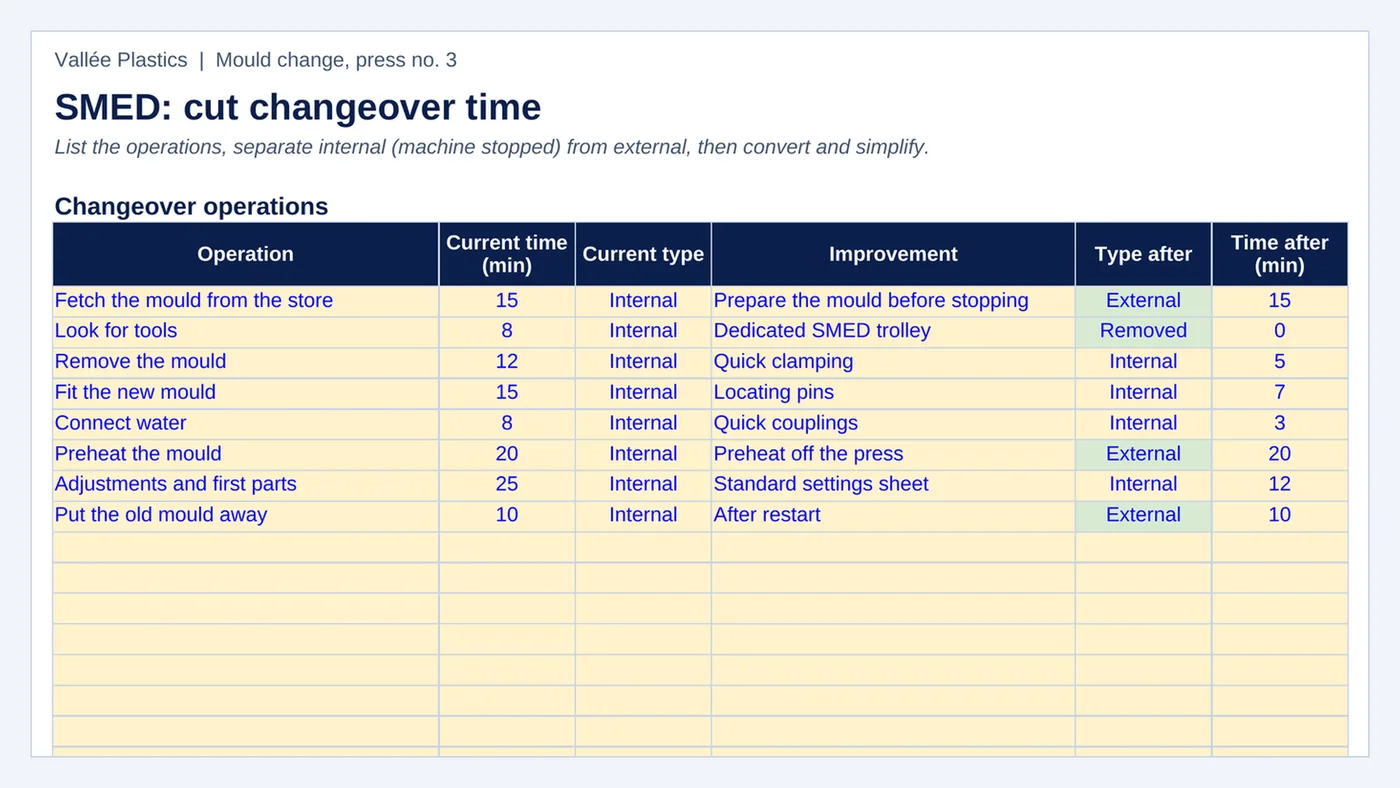
SMED
Changeover operations, internal or external, before and after improvement, and the downtime saved.
€15 excl. VAT · course included
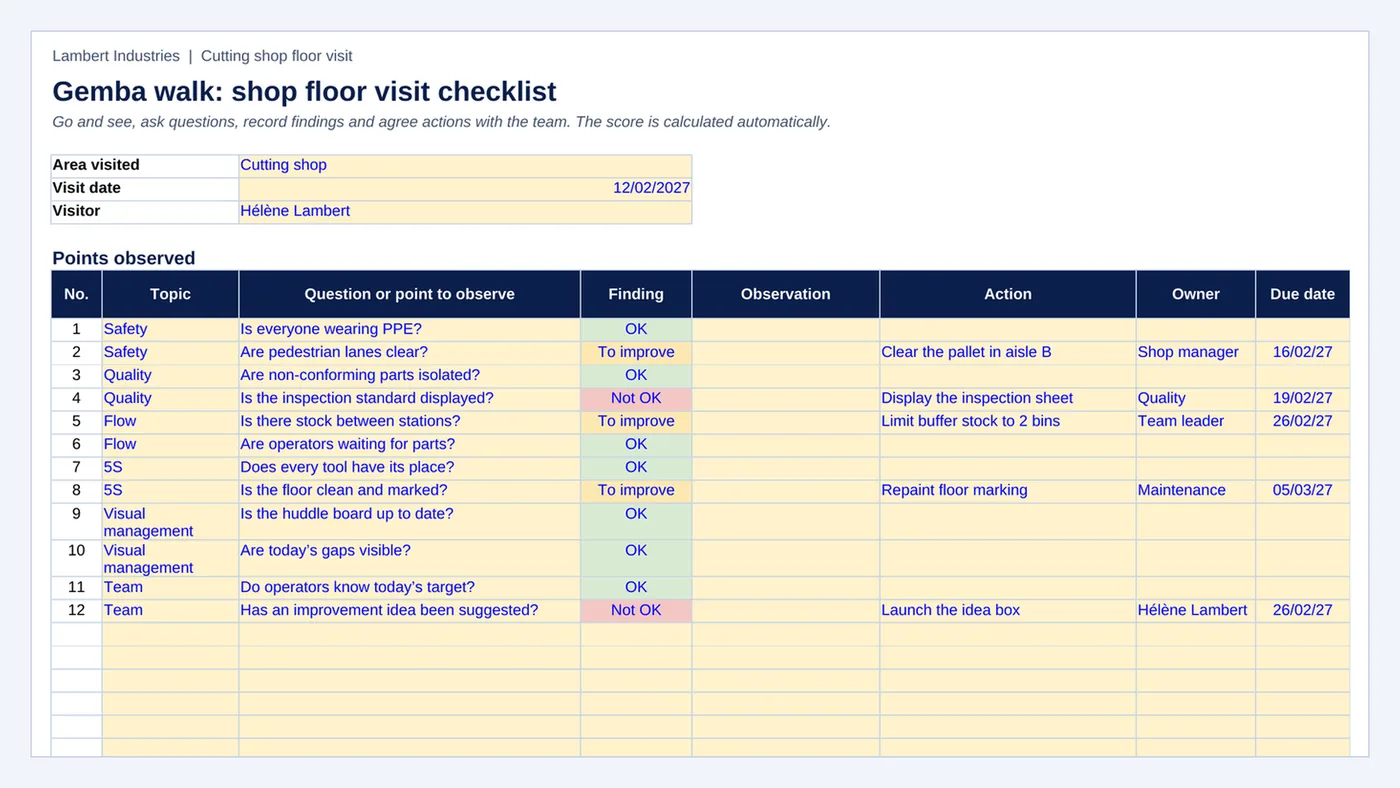
Gemba walk
The shop floor visit checklist by topic: findings, actions agreed with the team and the visit score.
€15 excl. VAT · course included